- Linux
- Dataflex
- Networking
- Postgresql
- Proxmox
- Windows
- Wordpress
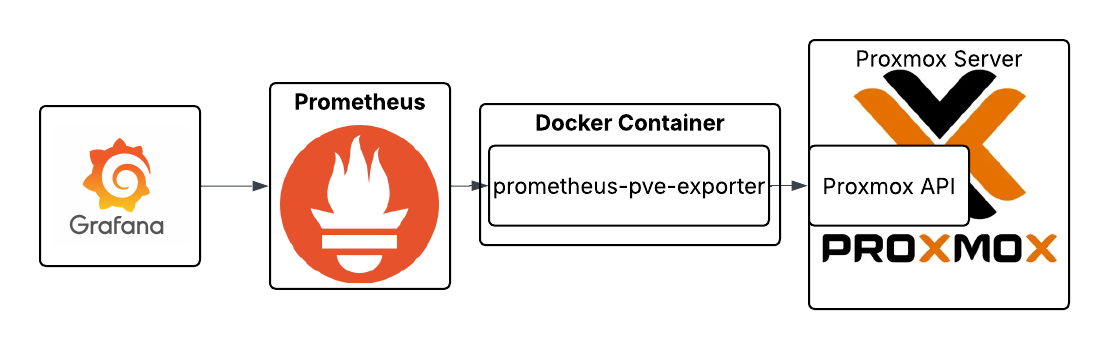
Proxmox Monitoring with Grafana and Prometheus
The following is a guide on how to add Proxmox metrics to a Grafana dashboard. This assumes you have already got a Grafana and Prometheus setup already established. If you don’t, a simple experimental environment can be created using the following docker-compose.yml .
services:
  prometheus:
    image: prom/prometheus:latest
    container_name: prometheus
    ports:
      - "9090:9090"
    volumes:
      - ./prometheus.yml:/etc/prometheus/prometheus.yml:ro
      - prometheus_data:/prometheus
    restart: unless-stopped

  grafana:
    image: grafana/grafana:latest
    container_name: grafana
    ports:
      - "3000:3000"
    environment:
      - GF_SECURITY_ADMIN_USER=admin
      - GF_SECURITY_ADMIN_PASSWORD=admin
    volumes:
      - grafana_data:/var/lib/grafana
    depends_on:
      - prometheus
    restart: unless-stopped

volumes:
  prometheus_data:
  grafana_data:
Once you run docker compose up -d, you’ll have:
- Prometheus on http://localhost:9090
- Grafana on http://localhost:3000
(login withadmin / adminand connect Prometheus as a data source)
Create user on the Proxmox server
This user is used by the promox-pve-exporter to be able to connect to the Proxmox API and retrieve the servers metrics.
pveum user add prometheus@pve

# Grant read-only permissions
pveum acl modify / --user prometheus@pve --role PVEAuditor
Generate an API token for the user and save it for later
pveum user token add prometheus@pve pve-exporter-token --comment "Prometheus Exporter"
It should look like the following
┌──────────────┬───────────────────────────────────────────────┐
│ key          │ value                                         │
╞══════════════╪═══════════════════════════════════════════════╡
│ full-tokenid │ prometheus@pve!pve-exporter-token             │
├──────────────┼───────────────────────────────────────────────┤
│ info         │ {"comment":"Prometheus Exporter","privsep":1} │
├──────────────┼───────────────────────────────────────────────┤
│ value        │xxxxx                                          │
└──────────────┴───────────────────────────────────────────────┘
Exporter Node
This setup runs the Proxmox Node Exporter on a separate machine in a Docker container. It can be run directly Proxmox machine itself also.
We run it on a separate node cluster that collects metrics on all our different Proxmox clusters. We find this a better and more scalable way to manage it.
Create a pve.yml to store the access details to the Proxmox cluster
default:
  user: prometheus@pve
  token_name: pve-exporter-token
  token_value: "<YOUR_TOKEN_SECRET>"
  verify_ssl: false # true if you have a valid SSl trusted on your exporter
Then use the following docker-compose.yml for easy setup and running of the container.
services:
  pve-exporter:
    image: prompve/prometheus-pve-exporter:latest
    container_name: pve-exporter
    ports:
      - "9221:9221"
    volumes:
      - ./pve.yml:/etc/prometheus/pve.yml:ro
    restart: unless-stopped
To run it, execute the following
docker compose up -d
You can verify the exporter is running by doing the following on the exporter node, or replacing localhost with the exporter node’s IP address.
curl http://localhost:9221/metrics | head
Confirm access to the Proxmox node
The exporter retrieves the metrics from the Proxmox API. So prometheus calls it, it needs to have the target set. The following curl command can show this is working.
curl http://<exporter node IP>:9221/pve?target=<pve node IP>
If you get access forbidden, 403, this may fix it by assigning the ACL to the token. Run this on the Proxmox server.
pveum acl modify / \
  --token 'prometheus@pve!pve-exporter-token' \
  --role PVEAuditor
Connecting to Prometheus
In your prometheus.yml add the following scrape job. Replace the Proxmox Node IP with the IP address of your Proxmox machine, and the Exporter Node IP with the external IP of your Proxmox Node Exporter.
- job_name: 'proxmox'
    params:
      target: ['<Proxmox NODE IP>']
    scrape_interval: 5s
    metrics_path: /pve
    static_configs:
      - targets:
        - <Proxmox NODE IP>
    relabel_configs:
      - source_labels: [__address__]
        target_label: __param_target
      - source_labels: [__param_target]
        target_label: instance
      - target_label: __address__
        replacement: <Exporter Node IP>:9221
Then restart Prometheus.
Breakdown of the scrape job
params:
  target: ['<Proxmox NODE IP>']
The above adds ?target=<Proxmox NODE IP> to the exporter URL.
So when Prometheus calls the exporter it becomes
http://<Exporter IP>:9221/pve?target=<Proxmox NODE IP>
Then we have the static_configs → targets
    static_configs:
      - targets:
        - <Proxmox NODE IP>
This is what Prometheus uses as its internal list of “real” targets. They show up as the __address__ label, which we then change using the relabel_configs.
The replacement: <Exporter Node IP> tells Prometheus to scrape the Proxmox Node Exporter, not the Proxmox machine. Otherwise it would normally scrape the address in the targets.
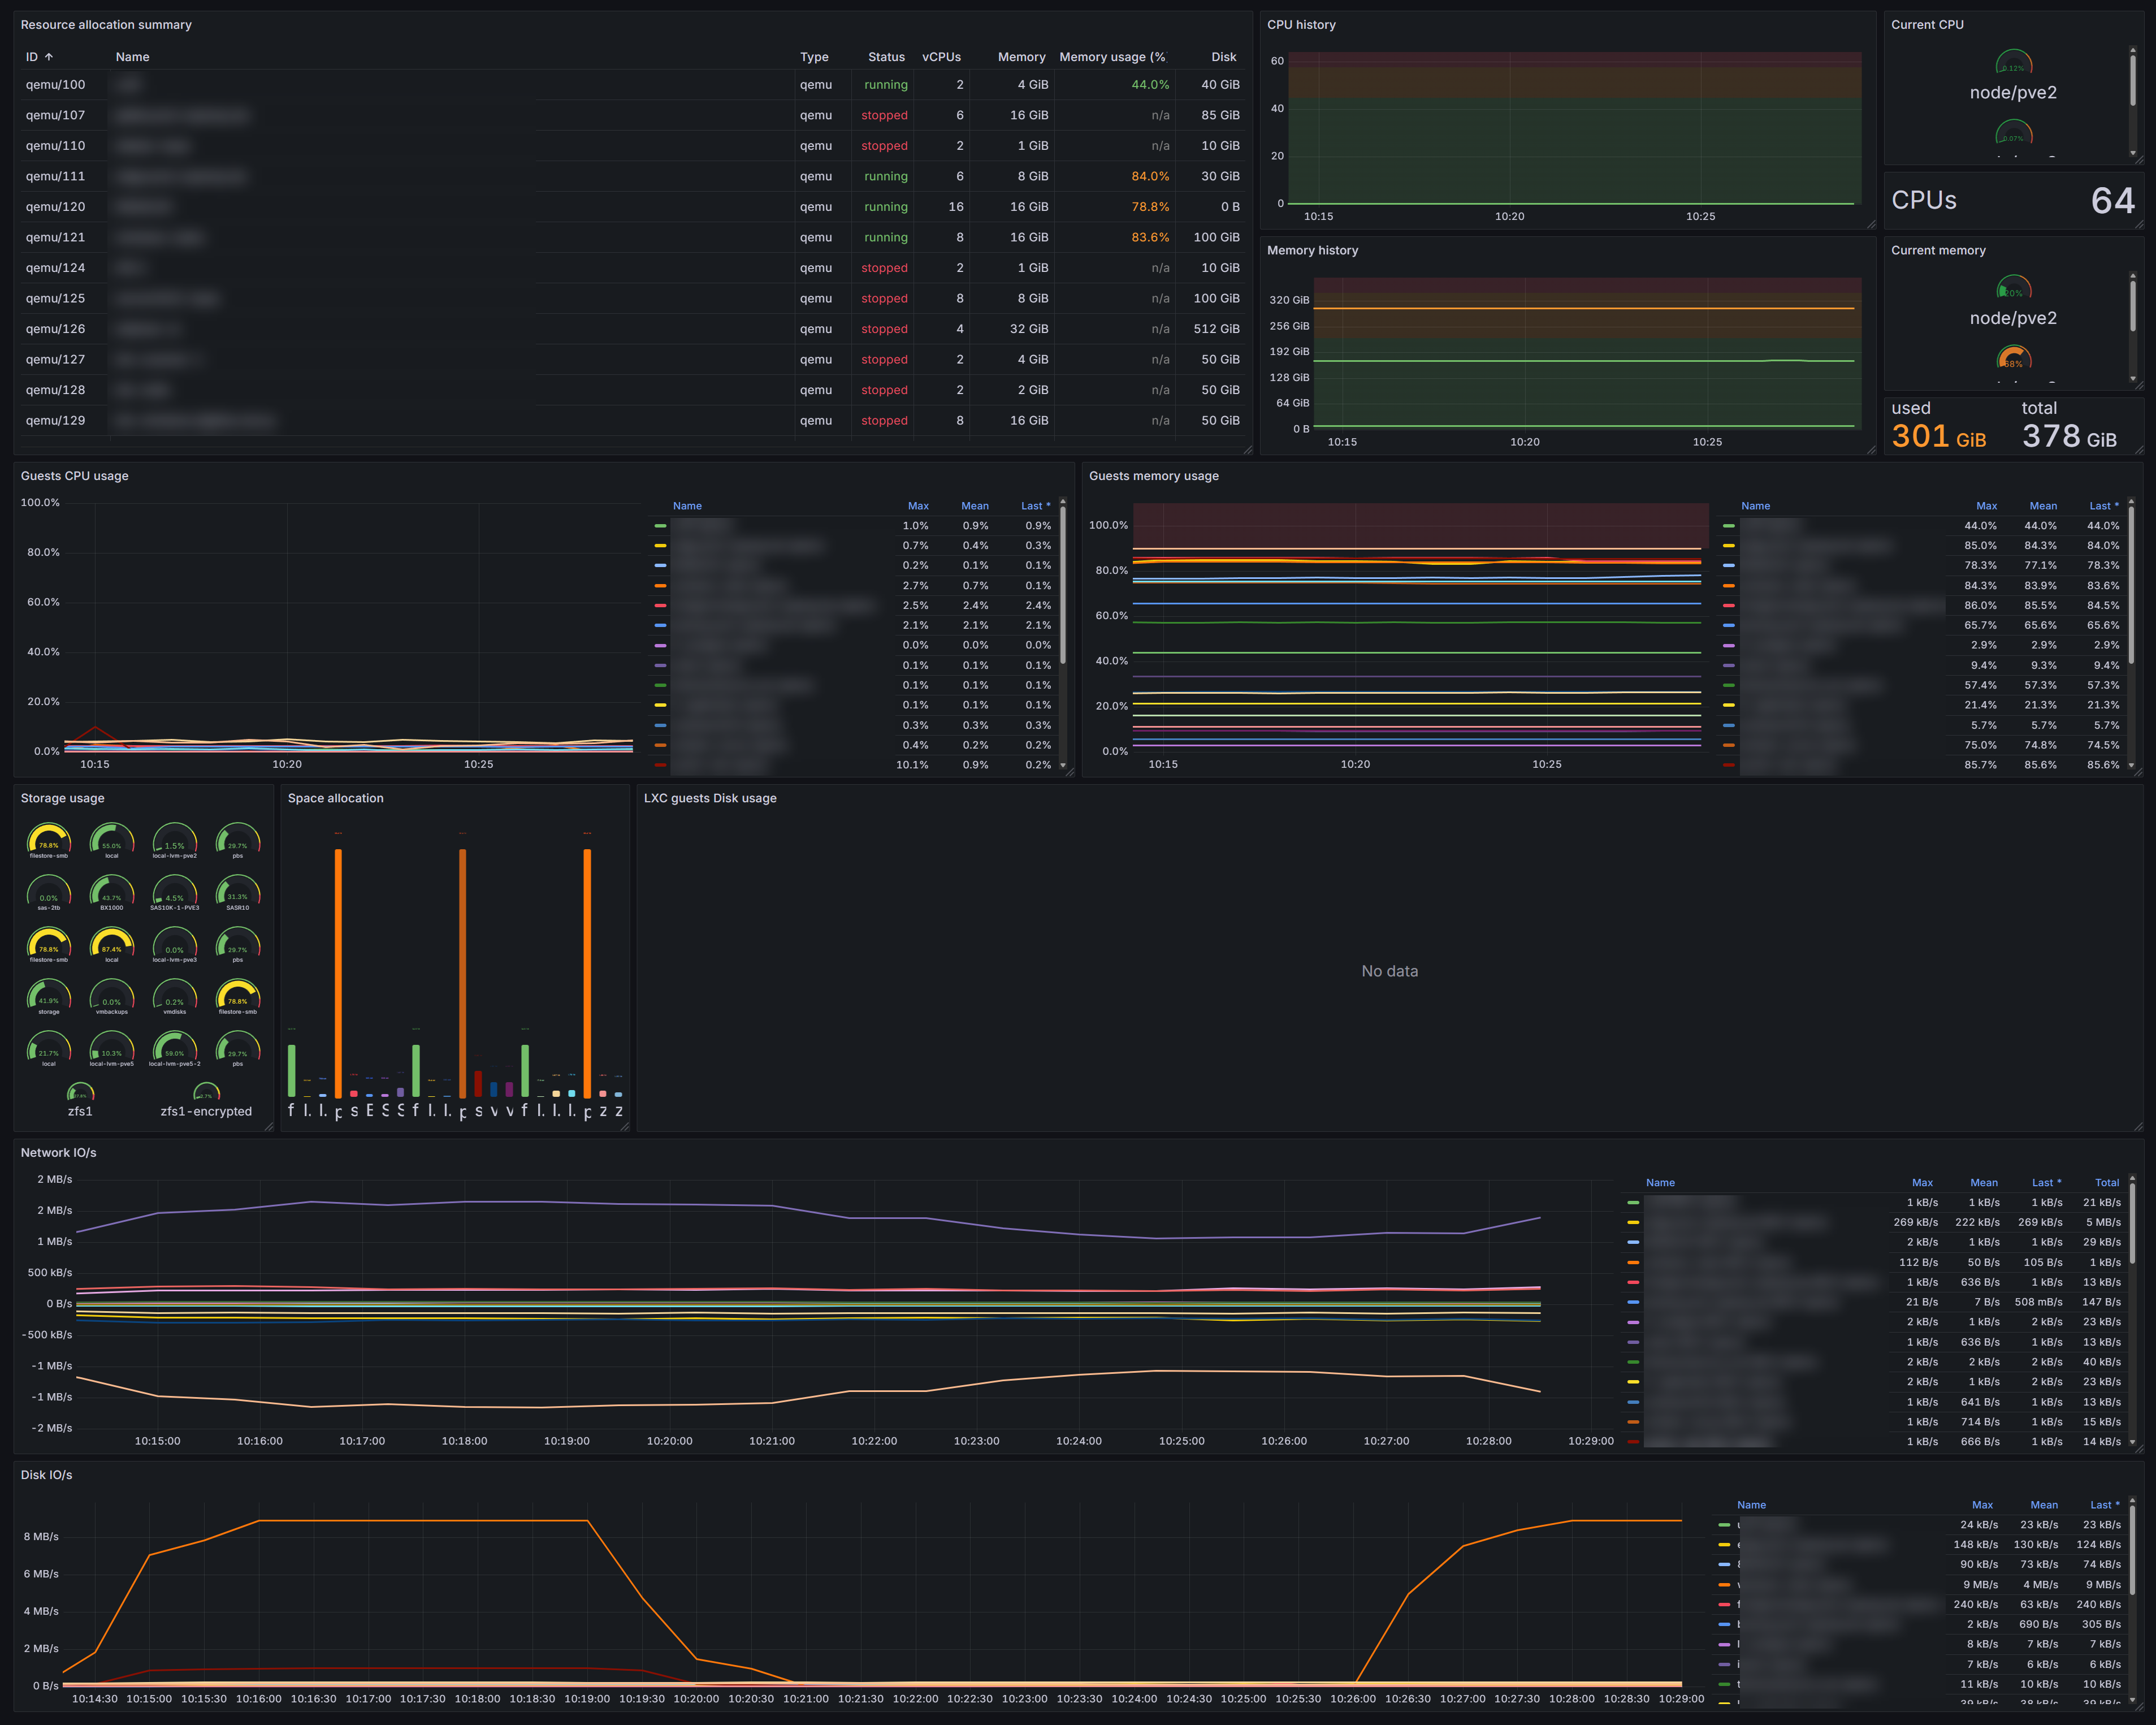
Dashboard
https://grafana.com/grafana/dashboards/10347-proxmox-via-prometheus/
The above will collect metrics for all nodes across the cluster. You can use the cluster above and choose the Prometheus data source, so it starts collecting those metrics.
Make the total CPU’s the whole cluster
sum(pve_cpu_usage_limit and on(id) pve_node_info)
Make the total RAM the whole cluster
sum(pve_memory_usage_bytes{instance="$instance"} and on(id) pve_node_info)
sum(pve_memory_size_bytes{instance="$instance"} and on(id) pve_node_info)